
Power BI
Reporting, dashboards and analytics easily, with the possibility of connection with other systems.
Data visualization helps to present the outputs of analytical tools in a form that is understandable to everyone.
Contact us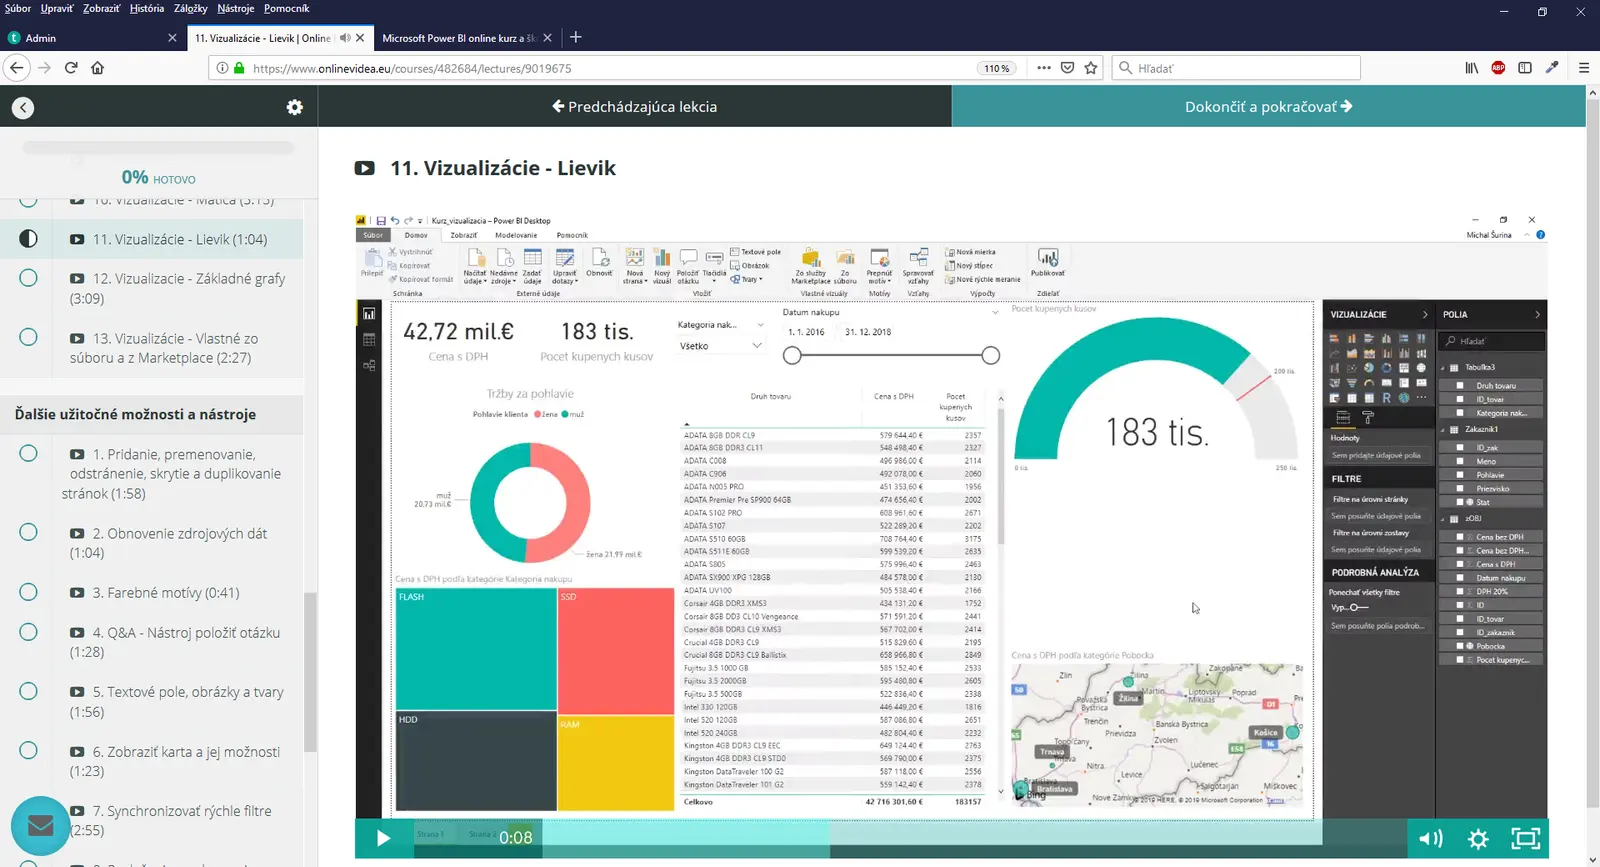
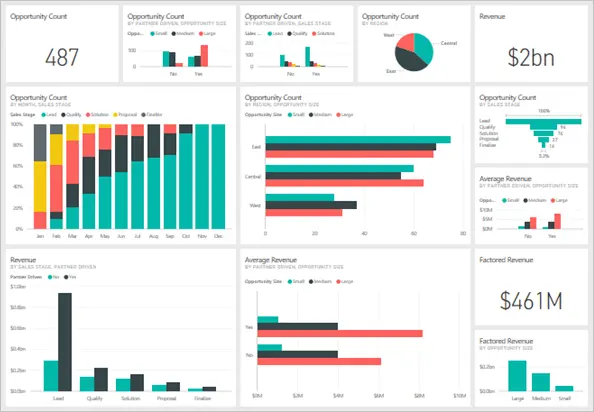
Better 1x to see than 100x to hear!
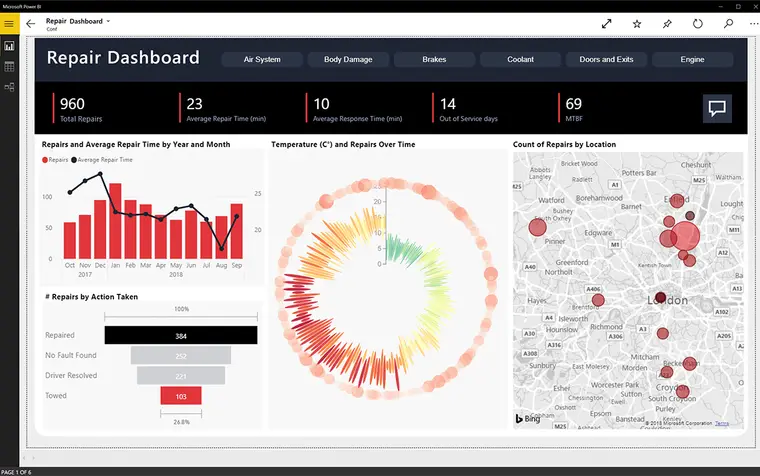
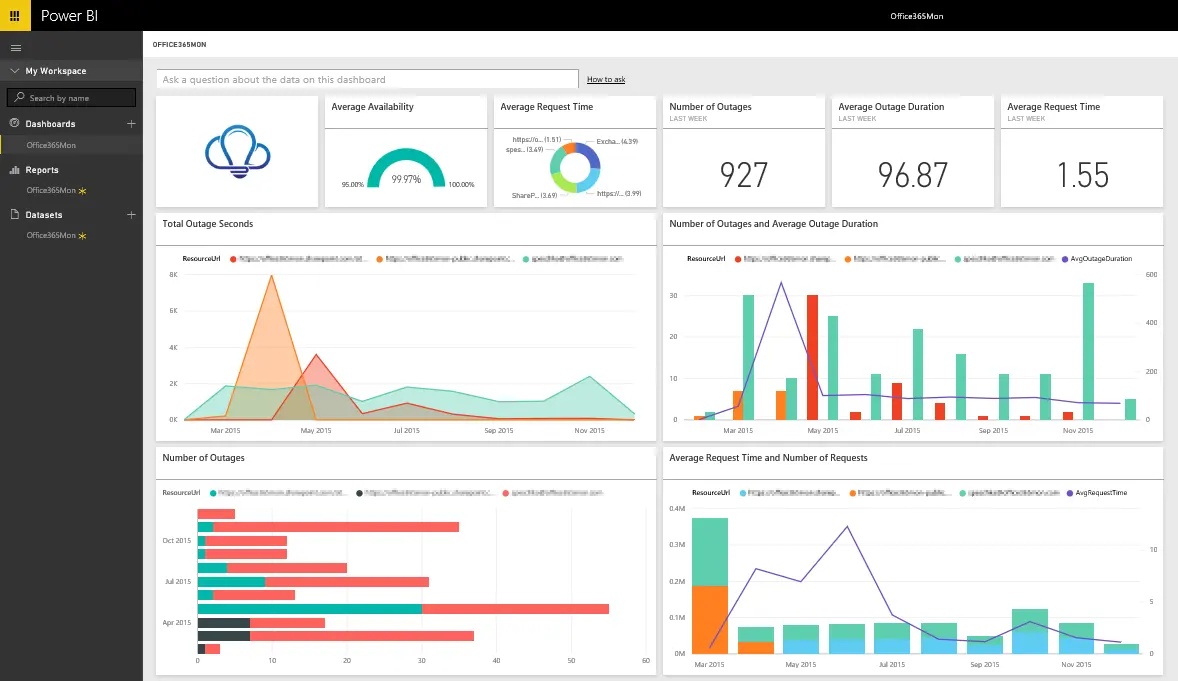
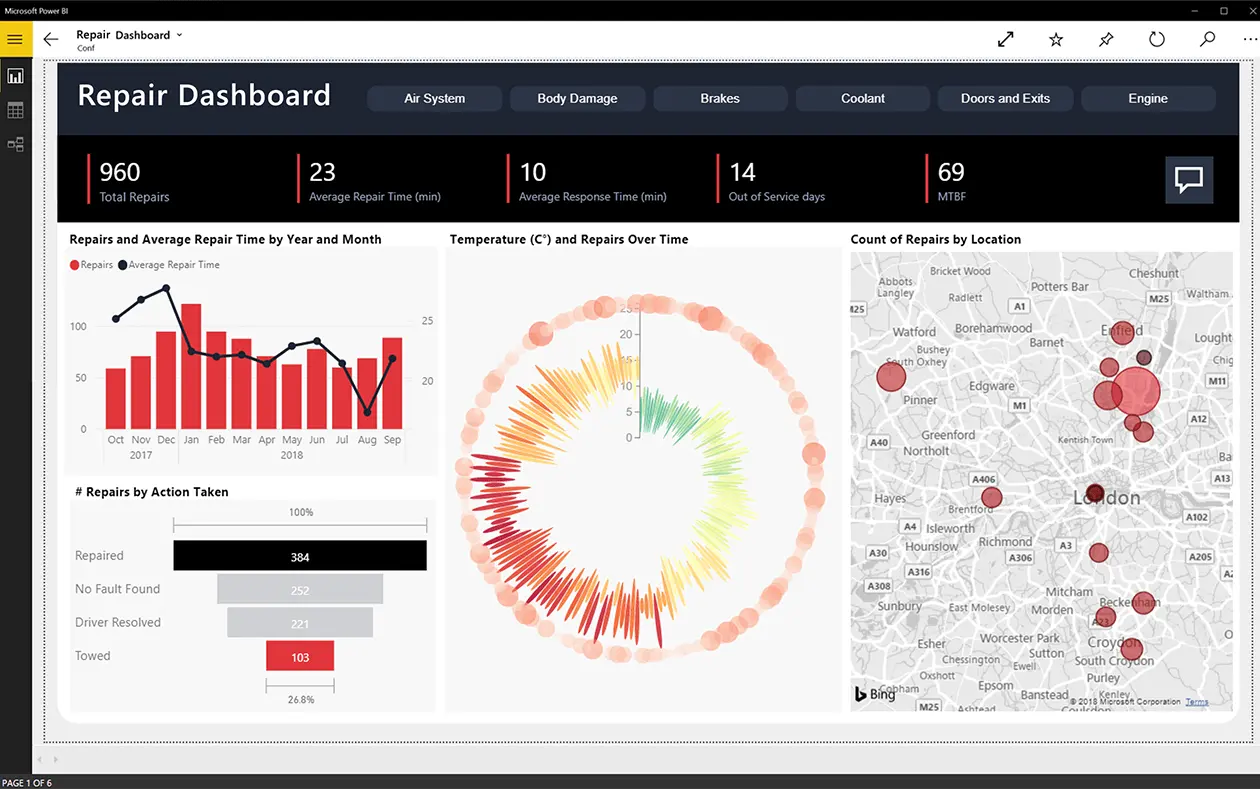
Data visualization is a graphical output of data analysis. At first glance, you can't read anything from hundreds of tables that have thousands of rows. But if this data is clearly displayed in different types of graphs, you will understand in a few seconds what your data wants to “tell” you.
After all, the human brain can process visual information much faster and better. Data visualization also hides a certain story, which in combination with a nice graphic design creates a complete whole, from which it is easy to read trends, but also deviations in the observed data.
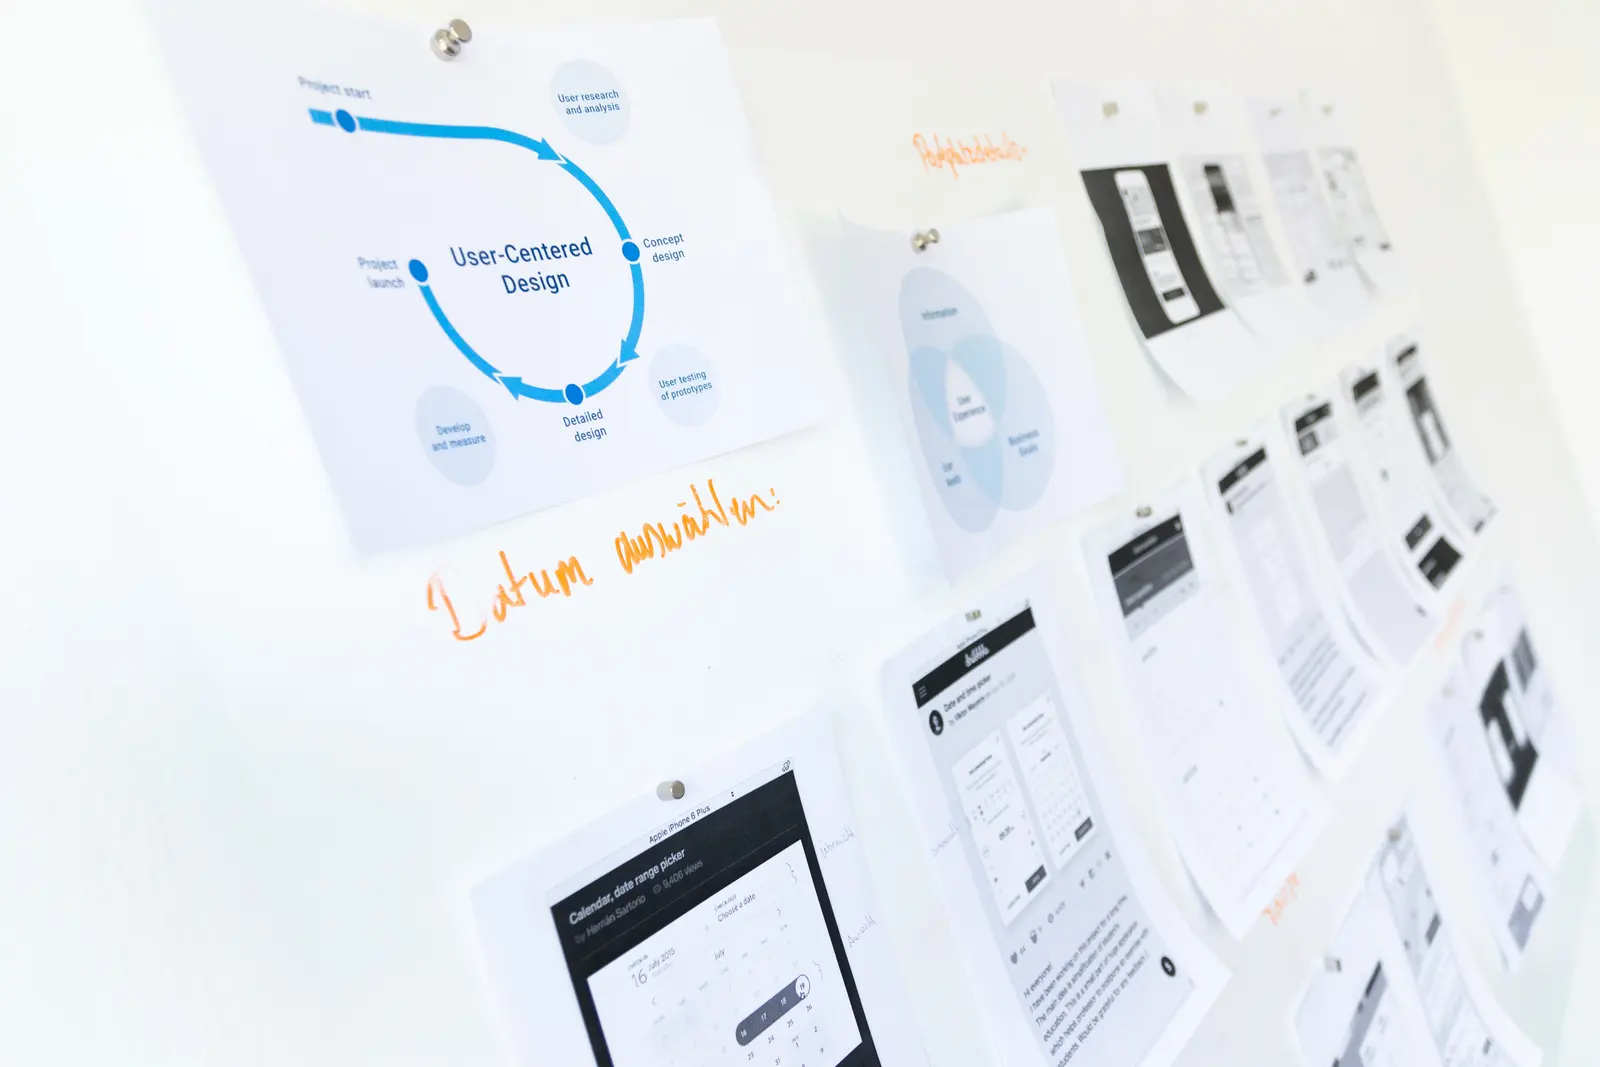
Reporting, dashboards and analytics easily, with the possibility of connection with other systems.

Unlock the performance of your data with an interactive interface.
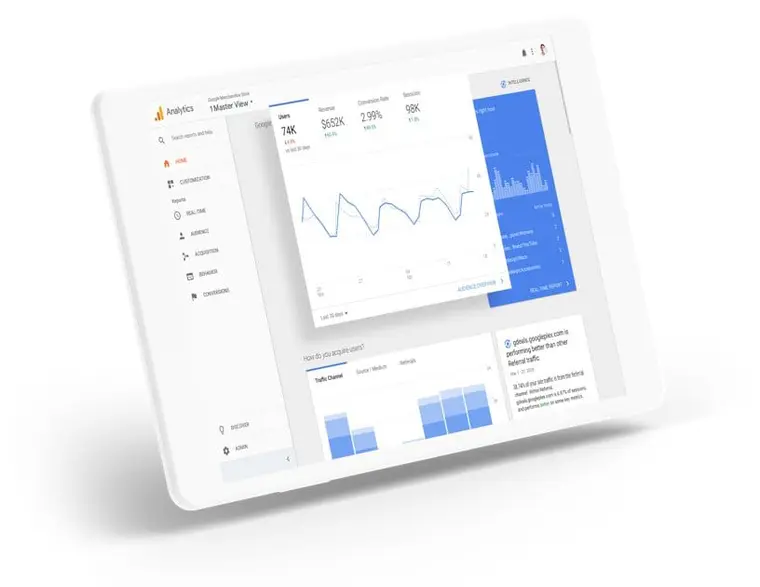
Gain a deeper understanding of your customers. Google Analytics gives you the ability to analyze data for your business in one place.
Data visualization also hides a certain story, which in combination with a nice graphic design creates a complete whole.
Contact us