VIZUALIZÁCIA DÁT
Vizualizácia dát napomáha prezentovať výstupy analytických nástrojov do podoby zrozumiteľnej pre každého.
Dátová vizualizácia je grafickým výstupom dátovej analýzy. Zo stoviek tabuliek, ktoré majú tisíce riadkov na prvý pohľad nevyčítate nič. Ale ak budú tieto dáta prehľadne zobrazené v rôznych typoch grafov, tak už po pár sekundách pochopíte, čo vám chcú vaše dáta “povedať”.
Lepšie 1x vidieť ako 100x počuť!
Predsa len, ľudský mozog dokáže vizuálnu informáciu spracovať oveľa rýchlejšie a kvalitnejšie. Dátová vizualizácia v sebe skrýva aj určitý príbeh, čo v kombinácii s pekným grafickým dizajnom vytvára ucelený celok, z ktorého ľahko vyčítať trendy, ale aj výchylky v pozorovaných dátach.
Nástroje

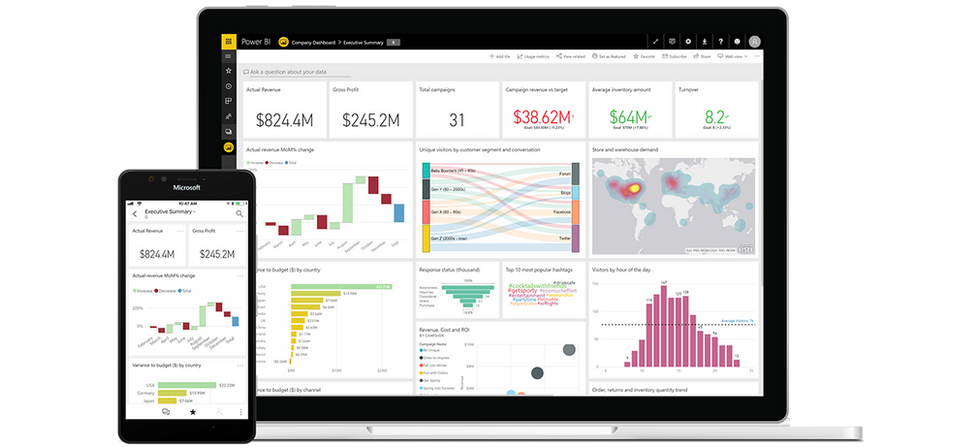
Powe Bi
Reporting, dashboardy a analytika jednoducho, s možnosťou prepojenia s inými systémami.

Google Data Studio
Odomknite výkon svojich údajov pomocou interaktívneho rozhrania.

Google analytics
Získajte hlbšie pochopenie vašich zákazníkov. Služba Google Analytics vám dáva možnosť analyzovať údaje pre vašu firmu na jednom mieste.


